
Why does a Spring Boot app consume more memory over time?
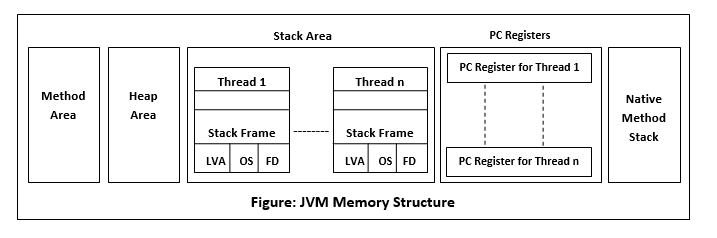
1. JVM Memory Model (Important Foundation)
Spring Boot runs on the JVM, which manages memory automatically.
Main JVM Memory Areas
- Heap → Objects (most leaks happen here)
- Metaspace → Class metadata (used heavily by Spring)
- Stack → Thread method calls
- Native memory → Direct buffers, OS-level stuff

If memory keeps growing, it usually means:
Objects are still referenced, so GC cannot remove them.
2. Most Common Real Causes in Spring Boot
2.1 Memory Leaks (Real Leaks)
Not classic C-style leaks, but unintentional object retention.
Typical patterns
static List<User> users = new ArrayList<>();
This list will never be garbage collected.
Common leak sources:
| Source | Why it leaks |
|---|---|
| Static collections | Live for entire JVM |
| Singleton beans | Hold references forever |
| Listeners / callbacks | Never unregistered |
| ThreadLocals | Threads live long |
| Caches without eviction | Grow endlessly |
3. Spring Boot Specific Causes
3.1 Unbounded Caches
Spring uses many caches:
@Cacheable- Hibernate 2nd level cache
- Custom
Mapcaches
If no TTL / max size:
@Cacheable("users")
public User getUser(Long id)
This can grow forever.
3.2 Hibernate / JPA Session Growth
A very common real-world killer.
List<User> users = repository.findAll();
Hibernate keeps:
- Entity references
- Dirty checking snapshots
- Proxies
If used in batch loops:
for (...) {
   repository.save(entity);
}
Without:
entityManager.clear();
Result: Old generation fills up.
3.3 Connection Pool Leaks
If you forget:
ResultSet rs = ...
// but never close()
HikariCP will:
- Hold references
- Create new connections
- Memory grows + DB load grows
4. Thread Leaks (Very Dangerous)
Spring Boot creates:
- Web threads
- Async threads
- Scheduler threads
- Kafka consumer threads
If you create:
new Thread(() -> { ... }).start();
And never stop → thread stack + ThreadLocal remain forever.
5. ClassLoader Leaks (Hot Deploy)
In dev / Docker / Kubernetes:
Each redeploy:
- New ClassLoader
- Old one not GC’d
- Metaspace grows
This is why:
Apps crash after 20–30 redeploys.
6. Logging & Monitoring Side Effects
6.1 Logback Async Queue
If logs are faster than disk:
- Log queue grows
- Objects retained
6.2 Micrometer / Prometheus
Metrics tags like:
/user/{id}
Creates infinite label cardinality.
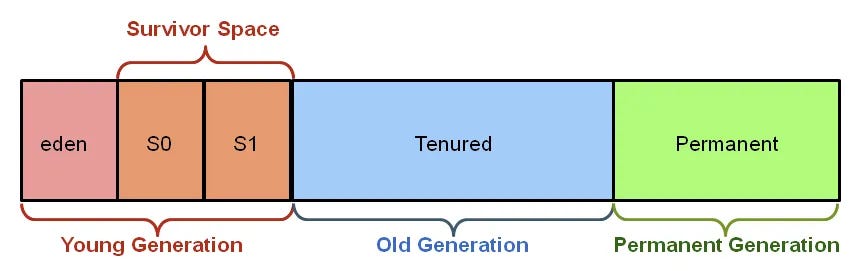
7. GC Illusion: Not a Leak but Looks Like One
Sometimes memory increases but is normal.
JVM strategy:
“Use memory aggressively, free lazily”
So:
- Heap grows
- GC doesn’t shrink immediately
- Looks like leak but isn’t
Check:
jcmd <pid> GC.run
If memory drops → not a leak.
8. Native Memory Leaks (Hardest)
Spring uses:
- Netty
- NIO
- Direct ByteBuffers
These are outside heap.
Heap looks fine, but:
Container killed (OOMKilled)
Because:
Native memory exhausted, not heap.
9. The Big 7 Real-World Reasons (90% of cases)
| Rank | Cause |
|---|---|
| 1 | Unbounded caches |
| 2 | Hibernate session growth |
| 3 | Static collections |
| 4 | ThreadLocal leaks |
| 5 | Connection leaks |
| 6 | ClassLoader leaks |
| 7 | Logging queues |
10. How Professionals Diagnose This
Step 1 – Enable GC logs
-XX:+PrintGCDetails -Xlog:gc*
Step 2 – Take Heap Dump
jmap -dump:live,format=b,file=heap.hprof <pid>
Step 3 – Analyze in tools
- VisualVM
- Eclipse MAT
- JProfiler
Look for:
“Dominators” → Who holds the references?
11. Golden Rule
Spring Boot never leaks by itself.
It only amplifies bad patterns.
Spring keeps references longer than you expect.
So mistakes hurt more.
12. Production-Safe Memory Rules
Always do this
| Rule |
|---|
| Never use unbounded caches |
| Close DB resources |
| Avoid static collections |
| Clear JPA sessions in batch |
| Limit thread pools |
| Set TTL on caches |
| Monitor native memory |
Mental Model (Simple)
Think like this:
If memory keeps growing, something is still holding a reference.
Garbage Collector is not broken.
Your object graph is.
Interview-Level One-Liner (For You, Nimai)
Since you are a Java dev with ~4 years:
“Spring Boot memory growth is usually caused by unbounded object retention such as caches, Hibernate sessions, ThreadLocals, or static references. The JVM heap grows because GC cannot reclaim reachable objects, not because Spring itself leaks.”
That single sentence is enough to impress in 90% interviews.